Visual Analytics Support for Qualitative Text Analysis

Designers often communicate through speech and sketches, especially in the early stages of design. Transcripts of design discussions are thus a rich medium for design researchers to understand how designers make decisions, resolve conflicts, or evaluate ideas. These transcripts are often analyzed manually, and words/phrases marked by the researchers to indicate a category of behavior.
Challenge
Qualitative analysis of text often employs a methodology called Grounded Theory, which involves systematically collecting and analyzing data to identify concepts of interest, identify relationships between these concepts, and finally use these to develop a theory that is grounded in the data. Making sense of unstructured text data, especially to identify items of interest, is a difficult and tedious process.
Solution
The grounded theory process bears a strong resemblance to the “visual sensemaking process” as identified by Pirolli & Card, which forms the basis of visual analytics. We draw from the field of visual analytics to illustrate an approach that supports the analyst in identifying and categorizing concepts of interest in a body of unstructured text.

Design Process & Features
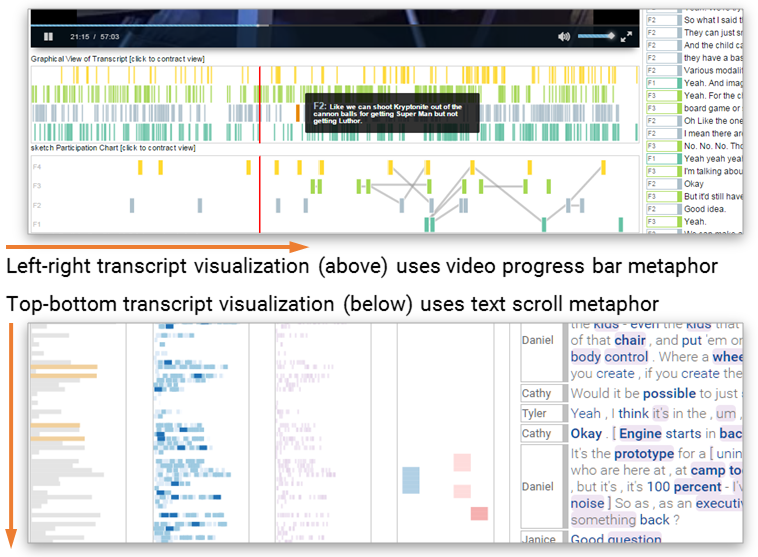
The approach to analyzing text is a little different from the approach to analyze a combination of video, text, and other data. In the latter case, context is often provided by the video, so all visualizations follow the left-to-right representation of time and order, using the same metaphor as the video seek bar. When analyzing text, however, the focus is on the text, which follows a top-down, “scroll” metaphor.

All timeline visualizations in VizScribe followed the
“time flows from left to right” metaphor that is
used in video progress bars.
However, since this interface is text-focused, all
visualizations followed the top-to-bottom metaphor used in
text documents/editors.
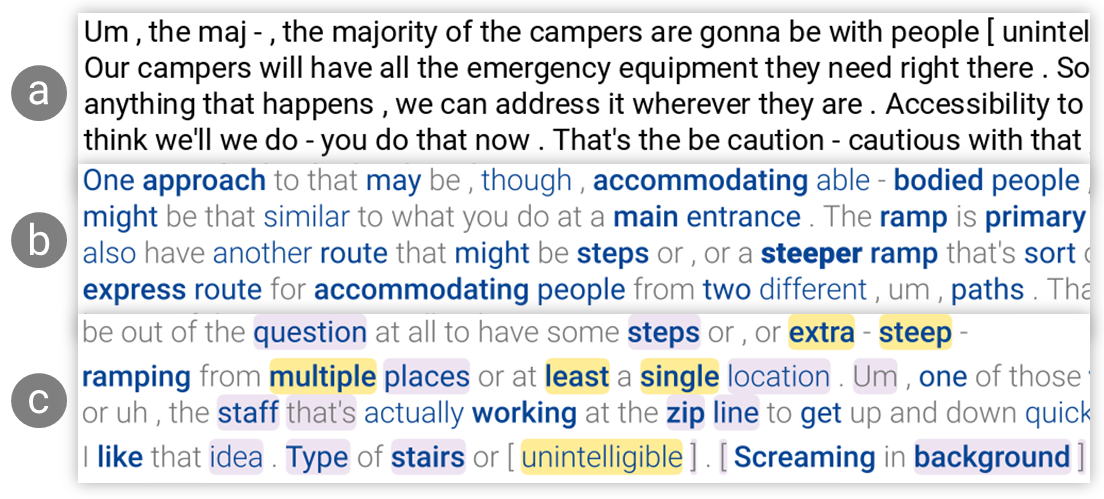
Identifying concepts is a key component of the grounded theory method. Concepts could be entities, phenomena, actions, or events. In text, these are nouns and verbs, with adjectives and adverbs adding attributes to these concepts. To make it easier for the user to identify concepts of interest, we use word information content—a measure based on how common a word is in a vocabulary of terms—to filter the display. Words with higher information content use a higher font weight, and words with a lower information content use a lower font weight. On top of this, we also use parts of speech tags overlaid on the text (see image below) to help identify concepts and their attributes.

The plain text view
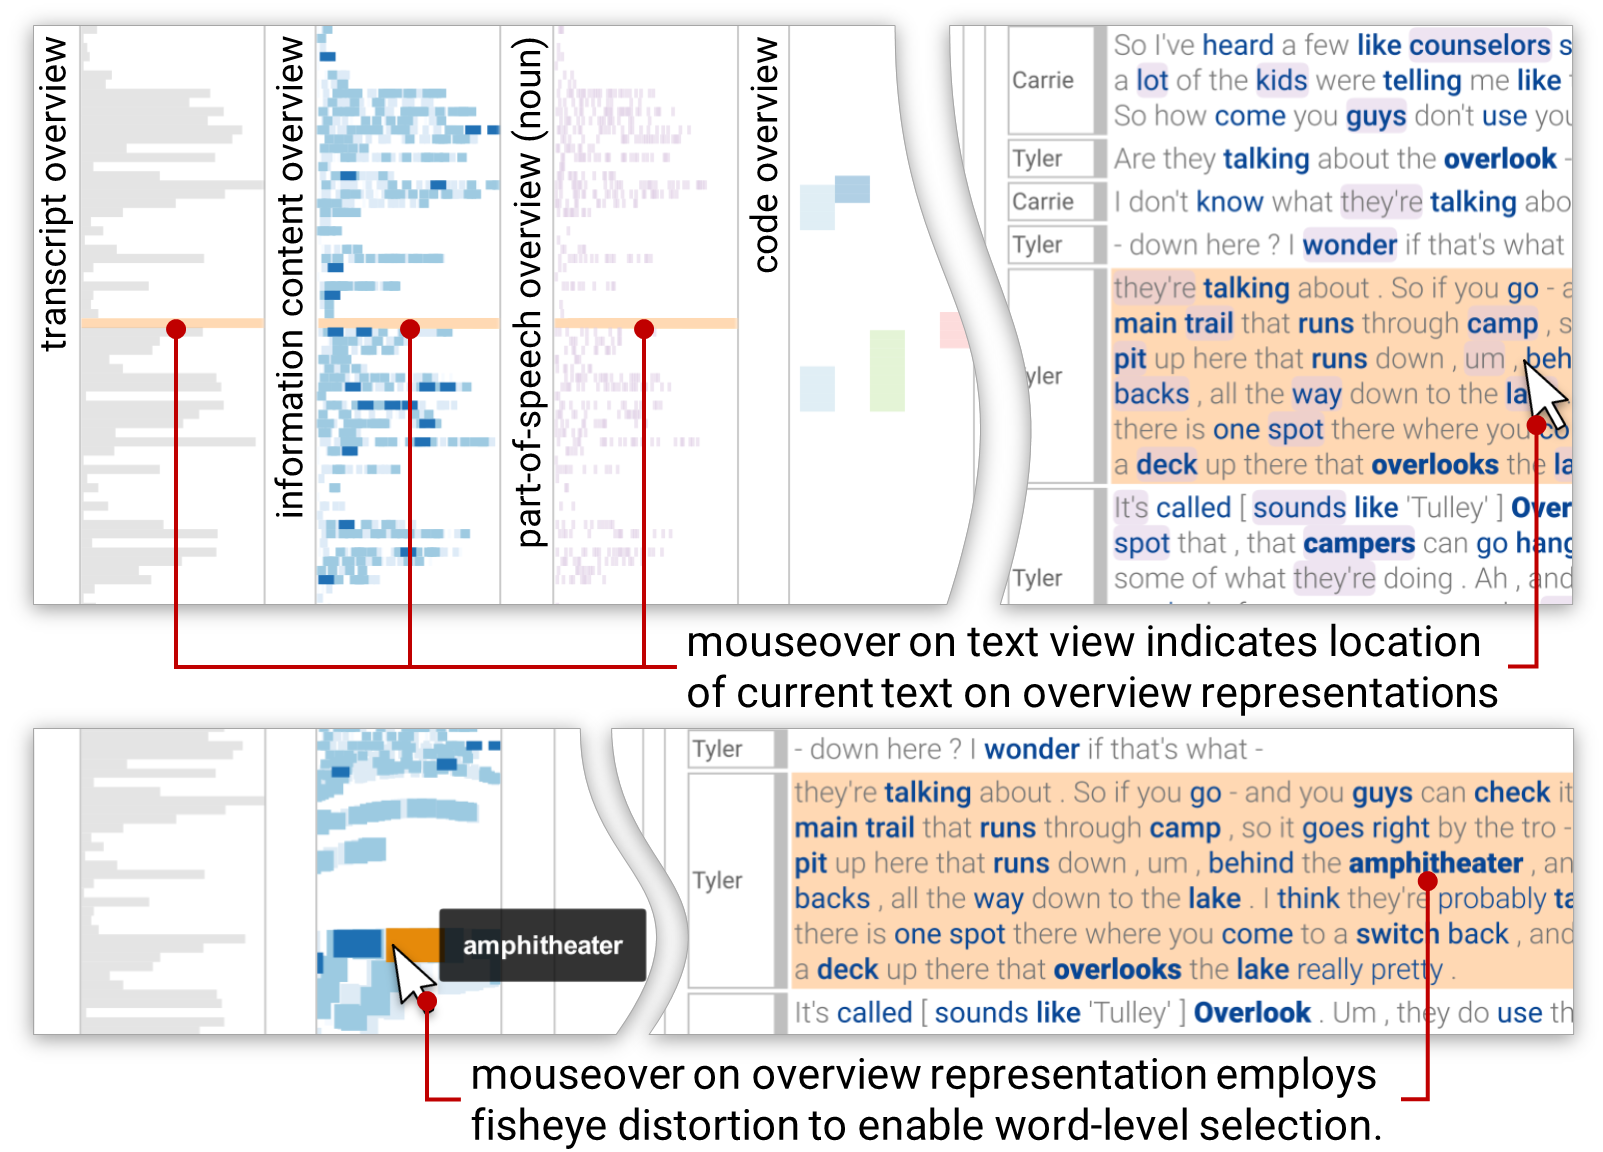
Multiple overviews of the text are provided to the left of the text display, each showing information such as line length, a heatmap of information content, and parts-of-speech occurrences. These are coordinated with the main text display, so that you can use the overview to preview and scroll to any word/line of interest.

An interaction with the text panel (top right) updates the
text overviews (left) indicating the overall position of the
current line in the text.
Interacting with the text overviews (bottom left) highlights
the corresponding line in the text panel is highlighted.
Fisheye distortion is used on overviews to aid accurate
selection.
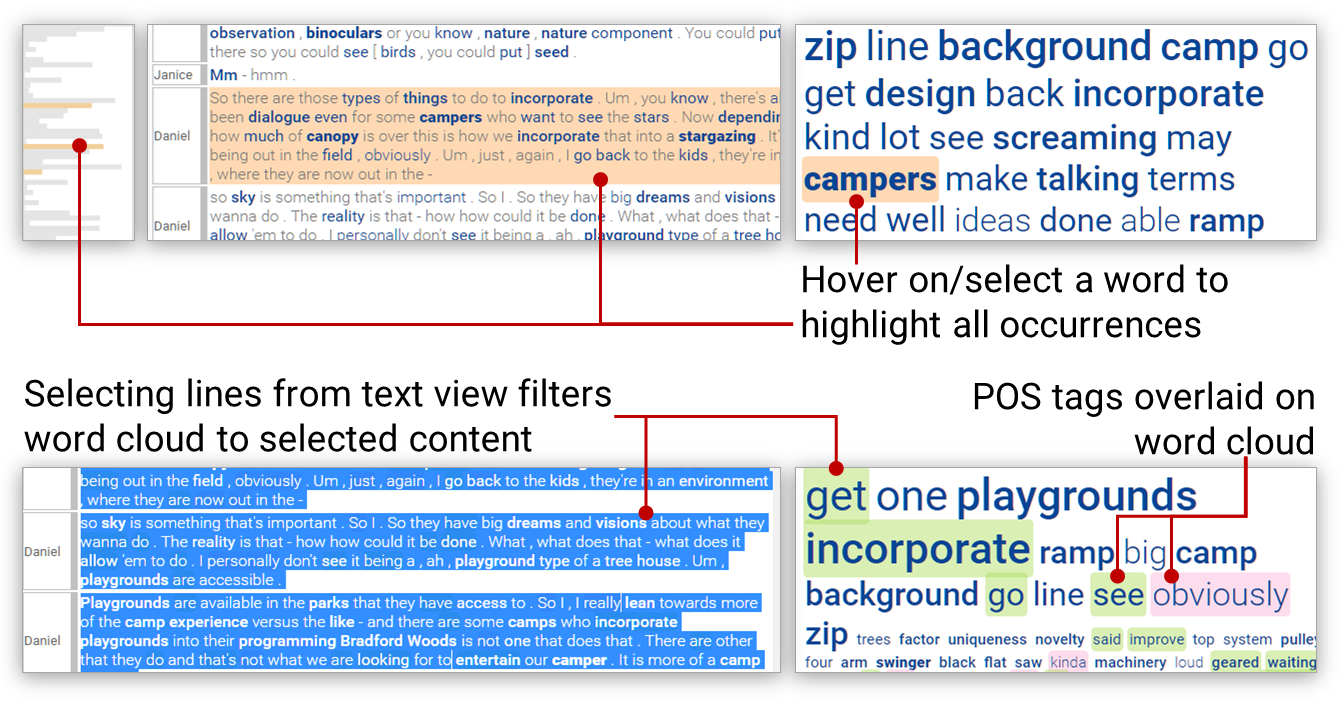
A thematic overview is provided by a word cloud automatically generated from the uploaded transcript. This word cloud is pruned of stop words, and uses the same skim formatting and POS tags as the main text to show additional information. This view can also be filtered by selecting a block of text, or by selecting a user-defined code that has been assigned to parts of the text. This updates the word cloud to only the selected text, giving a filtered overview.

An interactive word cloud provides an overview of the text,
with skim formatting and parts-of-speech highlights similar
to the main text view above.
Selecting a word from this display highlights all its
occurences in the text, as well as in the overview display.
Selecting specific lines of text updates the word cloud to
provide an overview of the selected text.
The video below demonstrates these and other interactions in the prototype visual analytics interface.