Comparing Sketching Performance between Paper and Digital Media
Part of my work on understanding how to best support the creative design process involved studying the challenges involved in providing digital support for sketching. I worked with long-time friend and collaborator, Karthik Badam on this project, mentored by both our advisors.
This study partly emerged from my observations as a teaching assistant for a design course titled “Computer-Aided Design and Prototyping” informally called “Toy Design” in the school of mechanical engineering. As part of this course, students were trained to sketch as (industrial) designers are trained to do:
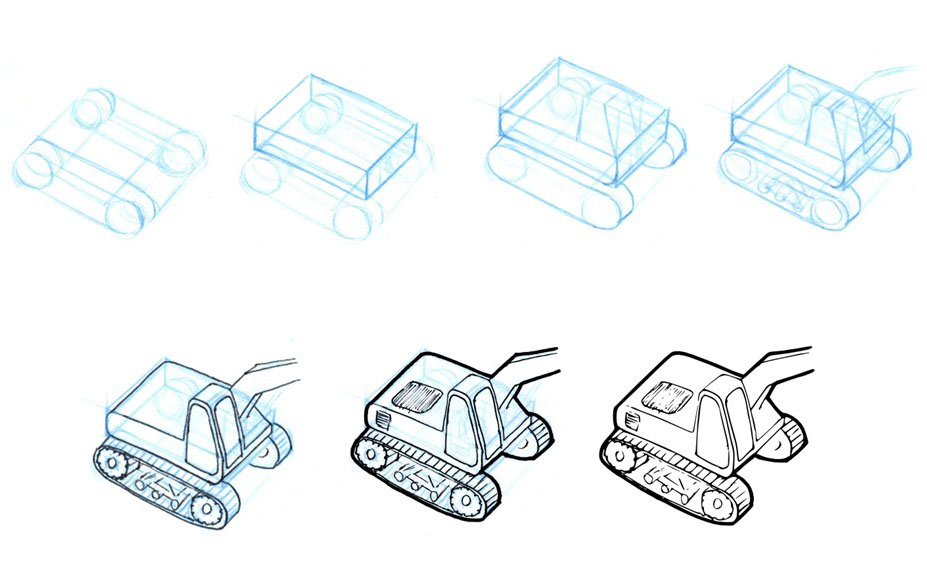
As taught to students of the toy design course for which I
was a TA.
Students use primitives such as cylinders and cuboids to
suggest more complex shapes (top row of image).
This helps them conceptualize complex shapes in the form of
simpler ones.
They then use a dark felt-tip pen to “ink in”
the final form (bottom row).
I used this process as a motivation to create two tasks: sketching (for the top row), and tracing (for the bottom). The goal of the study was to understand the differences between tablets with capacitive-touch styli and the traditional paper-pen medium. This was later followed up with a study that included the (then emerging) custom fine-tipped styli.
If you consider tracing as a process of following a predefined contour or shape, there exists a framework to study this process, called the Steering Law , which states that the difficulty in navigating a curve varies inversely with the width of the curve and directly with the length. Mathematically, this translates to:
$$ ID_C ∝ ∫_C {ds\over W(s)} $$
| $C$ | is a curve, |
| $ID_C$ | is the index of difficulty in navigating $C$, |
| $s$ | is a segment of $C$, and |
| $W(s)$ | is the width of $s$. |
Study Setup
On this basis, we set up a series of “tracing tasks” along curves of thickness 3mm. We chose 3mm as the width based on a number of pilot studies, and based on the fact that the capacitive-touch stylus required a contact area of 3mm for a touch to register. While Steering Law factors in the length and width of the curve, it appears to ignore its shape. To find out if shape is indeed a factor, we devised five curves, all withn the same length and width, but of different shapes.
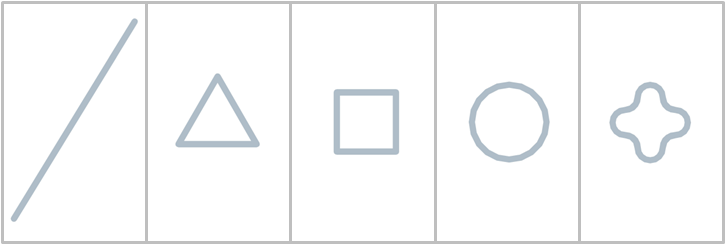
The shapes the participants had to trace on tablets as well
as on paper.
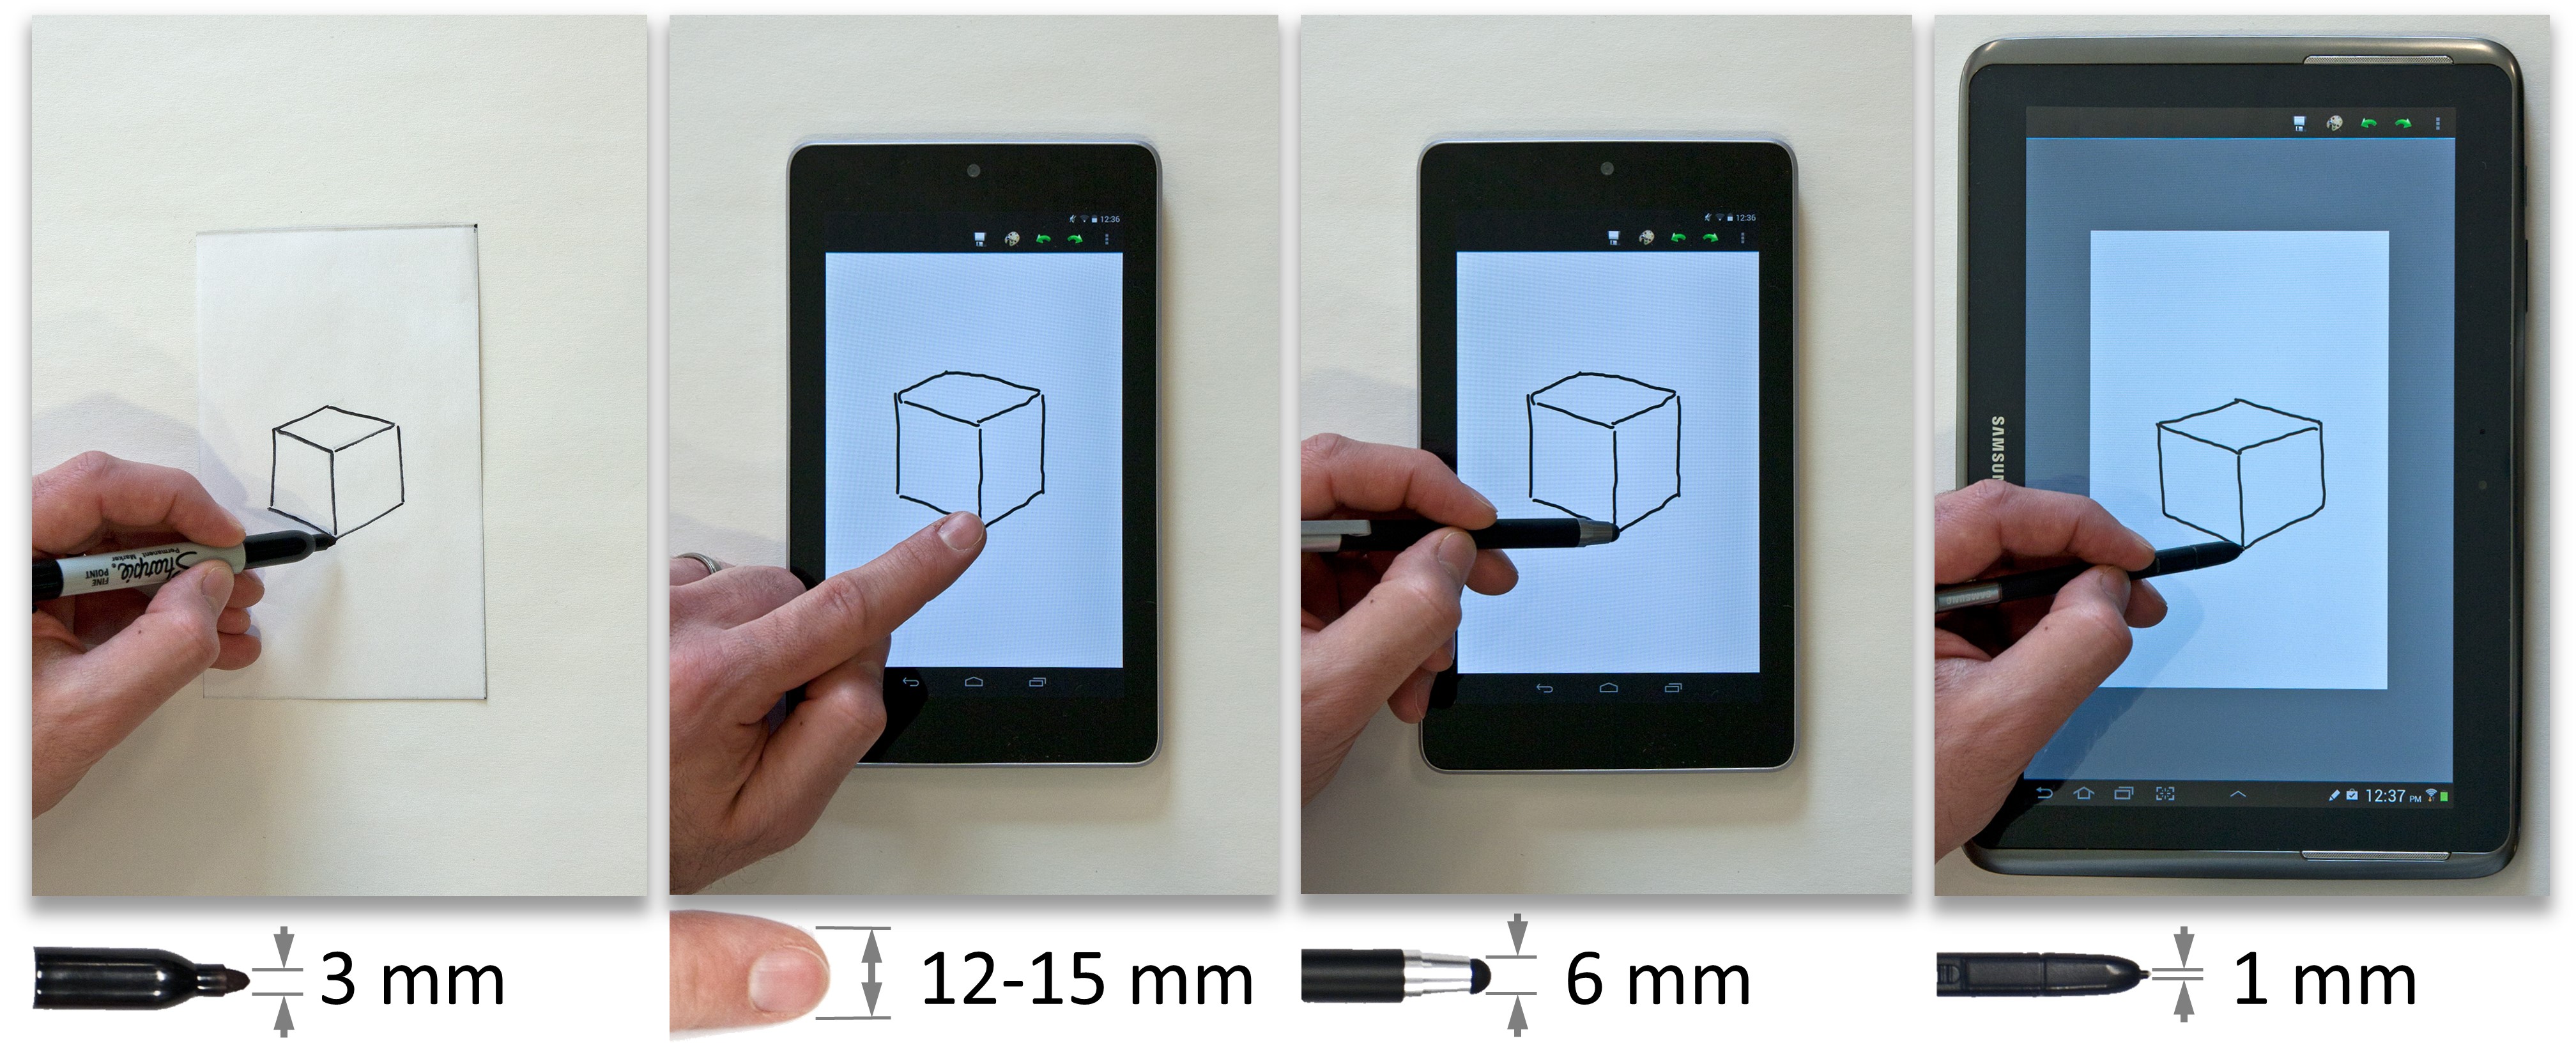
Participants used pen on paper, stylus on tablet, and finger
on tablet for all tracing tasks.
We recruited 14 participants from the same Toy Design course mentioned earlier, and asked them to trace these five shapes, each shape repeated in three media: pen & paper, stylus & tablet, and finger & tablet. Each shape-medium combo had three trials, and thus each participant went through 45 trials. We measured time taken for each task, and number of failures (number of times they strayed outside the 3mm-wide “path”.
In addition, we asked each participant to draw a cube and a cylinder with each medium, giving them three trials for each. They chose the best trial of the three for each medium, and the chosen shape was sent out as part of a crowdsourced survey to determine if there was a distinction in the quality of the shapes drawn on each medium. The image below shows our setup for tracing and sketching: the “active area” was designed to be the same (7 inches diagonal) across all interfaces. The media used in the study are shown below.
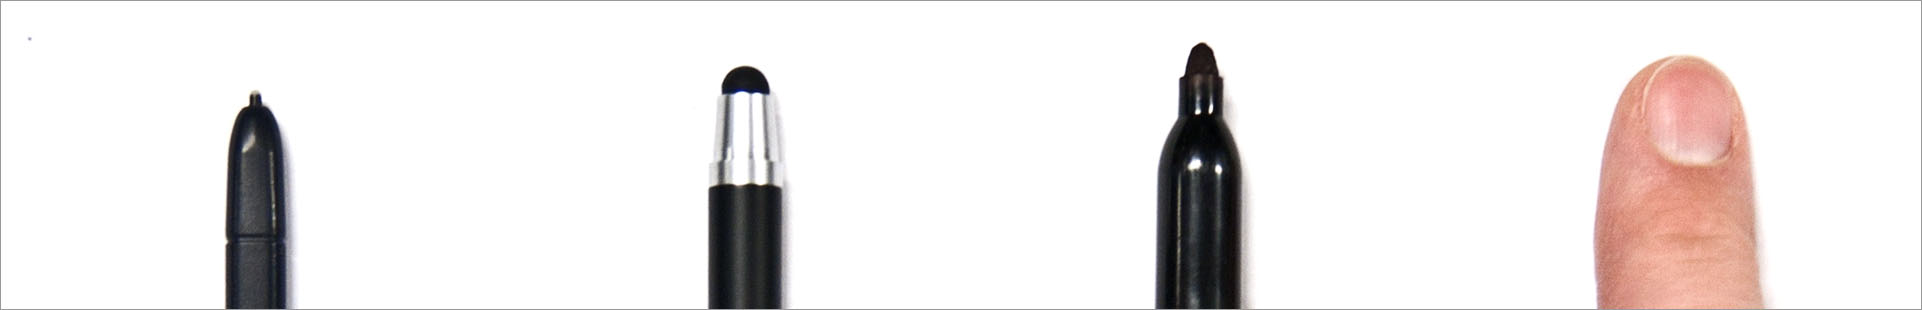
The sketching interfaces used for the study, from left to
right: paper with felt-tip marker, an Asus Nexus 7 tablet
using a finger for input, the same tablet using the Wacom
Bamboo capacitive-touch stylus, and a Samsung Galaxy Note
10.1 with digital S-Pen for the follow-up study.
Analysis & Findings
This being a within-subjects study (all participants experienced all conditions), we used a Repeated-Measures Analysis of Variance (RM-ANOVA) , followed by a post-hoc Tukey HSD for pairwise differences. The RM-ANOVA revealed a significant effect of medium as well as shape on tracing times. We used a logistic regression analysis to test the effect of medium on tracing failures. I've summarized the results briefly here, but for a more detailed analysis, please refer to our article, published in the ACM Advanced Visual Interfaces Conference Proceedings (link to pdf at the end of this article).
Effects on Tracing
Tracing speeds were found to be slowest for paper, and fastest for the stylus, with finger-tablet coming a close second. These differences were significant between pen-paper & stylus-tablet, and between pen-paper & finger-tablet. Speeds for the shapes showed a slight (expected) trend, with lower speeds as the shapes became more complex.
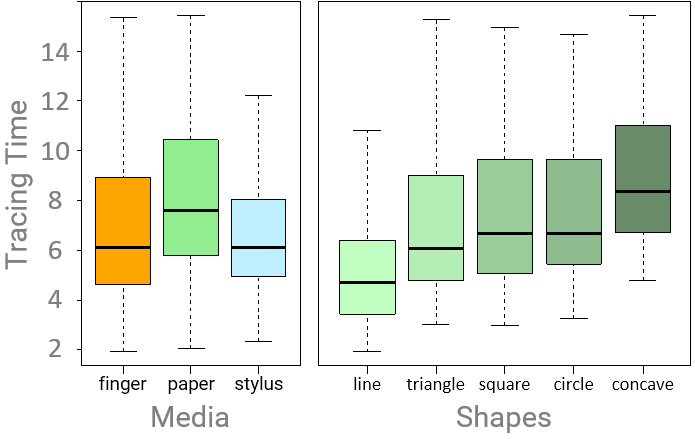
Tracing on paper took the most time, while tracing on the
tablet with the stylus was the fastest.
Tracing time also progressively increased with shape
complexity.
On the other hand, speed had its price: the number of failures. Medium had a significant effect on tracing failures, with significant differences between pen-paper & finger-tablet, and pen-paper & stylus-tablet.
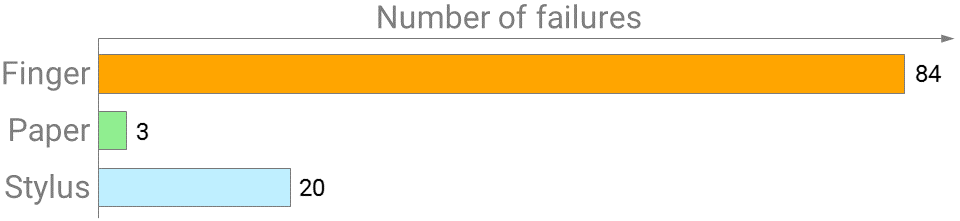
Number of failures (combined for all shapes) for the three
media used in the study.
A failure is when the traced path strays outside the path to
be traced.
Effects on Sketching
Recall that we had used a crowdsourced survey to evaluate the quality of sketches made by participants for each medium. We had obtained 42 cylinders (14 participants $\times$ 3 media) and 42 cubes from the participants. Now, it is difficult to ask any survey-taker to choose the best from 42 options, so we created 10 “lineups” each for the cylinders and the cubes, each showing five randomly-selected sketches from the total 42. We then came up with the metric of “perceived quality” (PQ), defined as: $$ PQ = {number~of~times~selected \over number~of~times~shown} $$ This helped normalize for the possibility that some sketches were poorly represented.
An RM-ANOVA of the responses, collected from 277 respondents, showed a significant effect of the medium on the PQ scores for sketches of the cube, but not of the cylinder, presumably because the cylinder, with fewer distinctive features, was either easier to draw, or difficult to judge. For the cubesm sketches made with the finger-tablet scored significantly lower than the remaining two media.
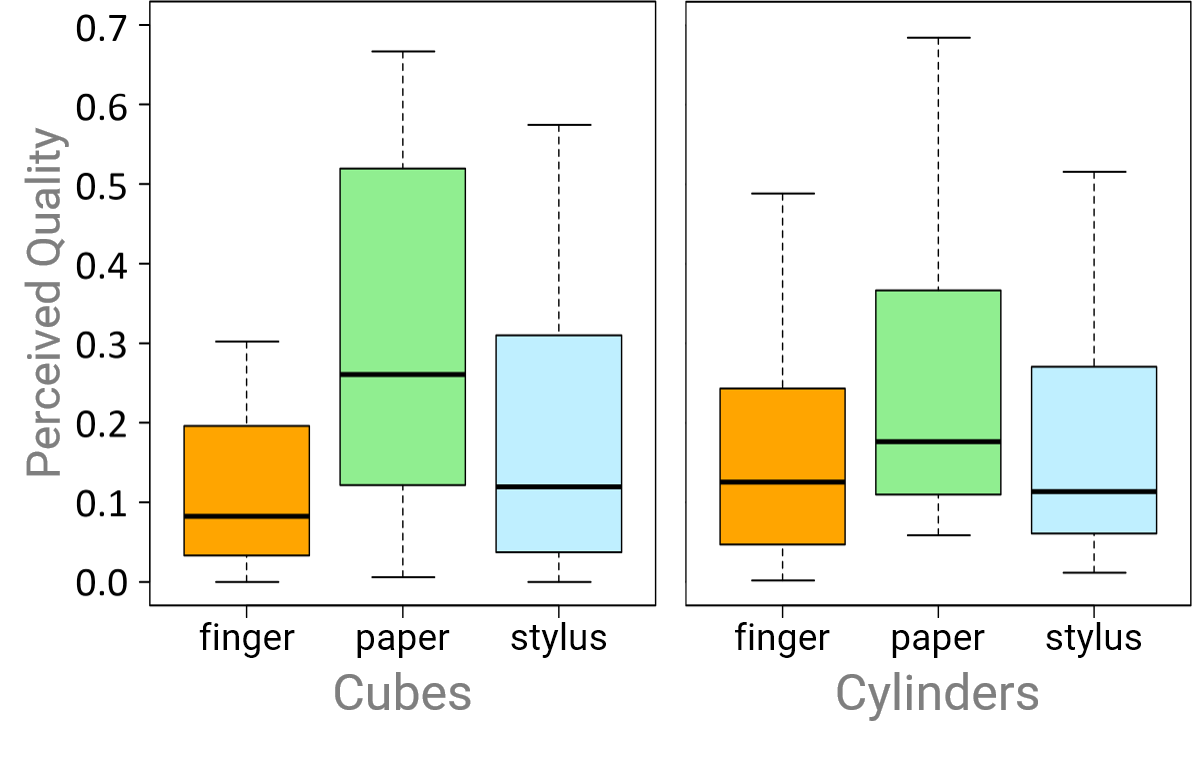
Perceived Quality (PQ) scores for each shape-medium
combination showed a significant difference between media
for cubes, but less so for cylinders.
Follow-Up Study with Sharp Stylus
We had identified four aspects that contribute to the difference between media:
-
Familiarity with the medium: participants were more familiar with paper than digital media for sketching, -
Friction between the input device and the medium surface, was lower for digital media, contributing to higher tracing speeds, -
Occlusion of the drawn shape by the tip of the input device: higher for the blunt stylus and the finger, than the felt-tip pen, -
Parallax between the point of contact and the visible shape, which was non-existent for the pen-paper medium, but not for the digital media where a pane of glass separated the contact point from the “mark” created.
Of these, interviewing the participants revealed the most contributing factor to be occlusion, which explained to an extent why the finger—with a much thicker tip—performed consistently worse than the stylus. However, the effect of occlusion makes it difficult to evaluate the effect of parallax. We therefore conducted a follow-up study comparing the stylus-tablet combination from study 1 with a Samsung Galaxy Note 10.1 with its custom sharp-tipped S-pen. The results were interesting: while tracing times with the S-pen were lower than the blunt stylus, the number of failures with the sharp-tipped stylus was higher than the blunt-tipped stylus! Interviews with participants seemed to suggest parallax and the “heft” of the styli to be a factor.
As mentioned earlier, this study was performed a few years ago, in 2012 and 2013. Since then, there have been a plethora of new styli and tablets that address the three issues of heft, parallax, and occlusion, and with enough time, should address the issue of familiarity as well. For more details of our study, please refer to the paper below (link to PDF also provided).
RELEVANT PUBLICATION
Tracing and sketching performance using blunt-tipped styli on direct-touch tablets
Sriram Karthik Badam,
ACM AVI Conference, pp.193-200, Como, Italy, 2014.
PDF