VizScribe: Representing Designers' Behavior using Visual Analytics
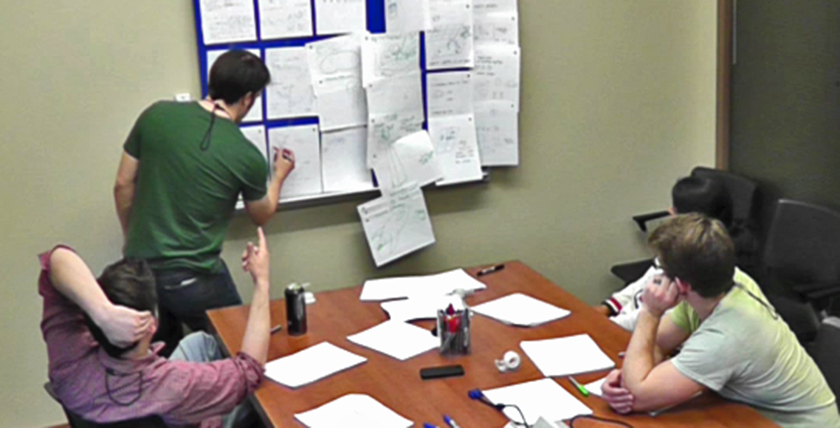
I am very intrested in how designers work, individually as well as in a team. Typically, researchers who are interested in these aspects study designers by recording and analyzing sequences of events. An “event” can be as specific as “picking up a pencil”, or more general, such as “evaluating a design”, depending on the research question being addressed. These events are logged with the help of video and transcript information, and there are several tools to aid this process of qualitative data analysis.
Challenge
Apart from video and transcripts, we now have more ways of collecting information of design activity. Since designers now sketch on tablets, we can extract logs of sketching activity. Using wearable sensors, we can get a sense of physical movement around the room, or instances of speech or silence. In order to integrate data collected through such means, we need a tool that is not only flexible enough to accommodate different kinds of timeline and text data, but also extensible to newer forms of data that we have not yet anticipated.
Solution
The solution I developed was a framework called VizScribe. It runs on the browser, and can be used to provide an integrated, interactive view of designers' activity from multiple perspectives.
Design Process and Iterations
The design of this interface was important from the point of view of both the layout of the visualizations as well as the choice of individual visualizations. My initial focus was on visualizing the text information in the transcript:
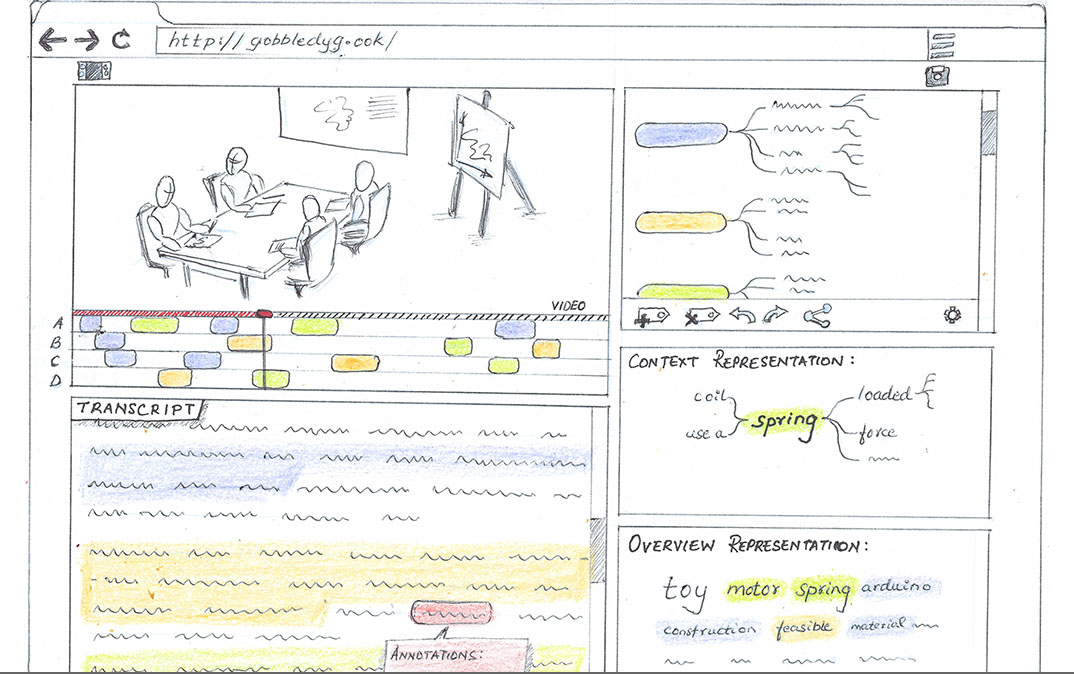
The initial sketch of the proposed interface
focuses on text representations.
The timeline representation shows who spoke when (speakers A
– D in the sketch).
Text overviews include word clouds and word trees.
The top right is a view of user-defined code hierarchies.
My first mockup of the interface included a word cloud, which was adapted from Jason Davies' word cloud generator . I made my version of the word cloud interactive, so hovering or clicking on any word in the cloud would show a word distribution timeline: an overview of the word occurrence over the video timeline. Finally, I used Mike Bostock's collapsible indented tree to create a mockup of user-defined code hierarchies.
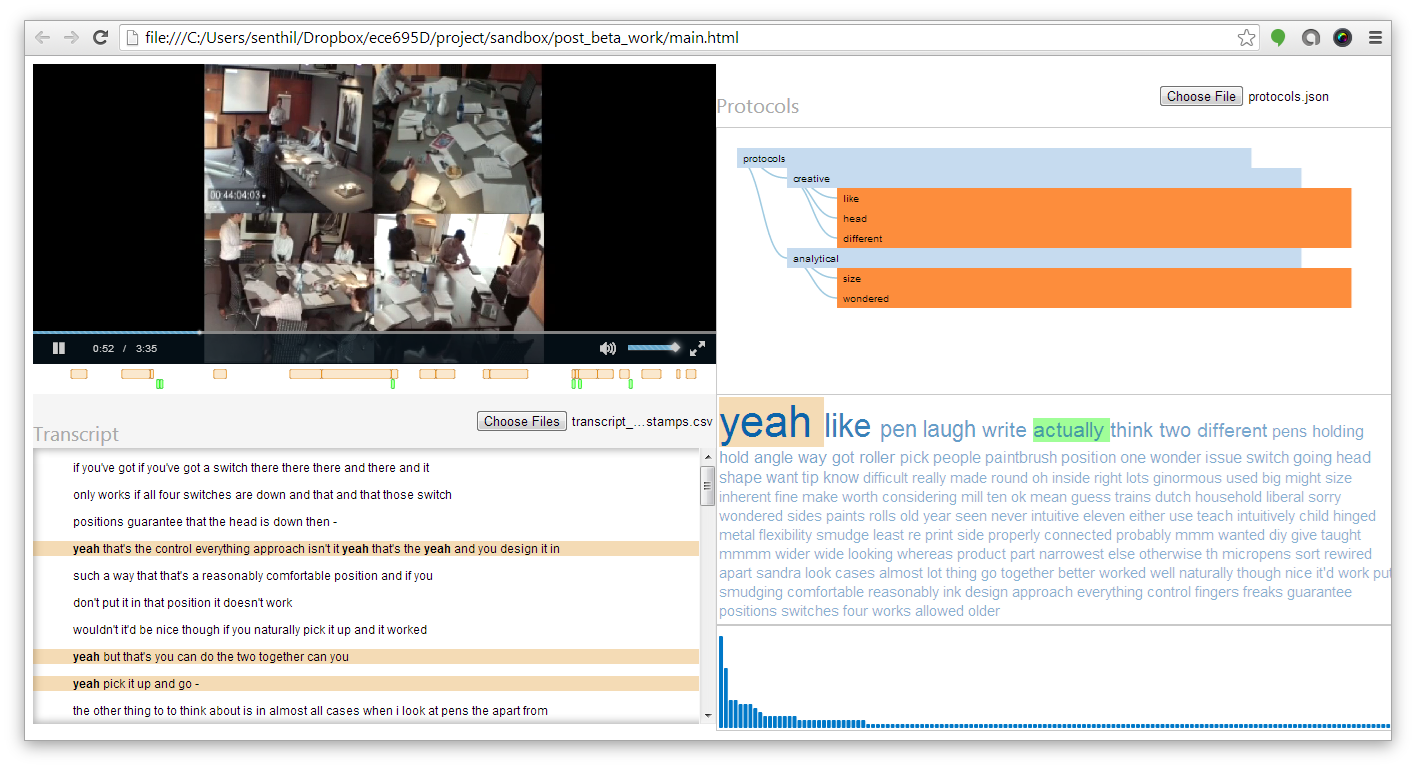
A first prototype of the interface kept the focus on the
text, using mouseover and mouseclick actions on the word
cloud to highlight all sentences in which the
hovered/clicked word occurred.
A bar graph of word frequencies corresponding to the word
(bottom right) was removed in later iterations after user
studies showed that it was not useful.
The next iteration followed the “overview + detail” visualization principles. Scrolling through the transcript shows your position in the transcript overview, and vice versa. Both the transcript and timeline views can be used to skip the video or scroll the transcript to specific timestamps. The layout also now featured a distinct “timeline view” section under the video to show events such as sketch logs, coded segments etc.
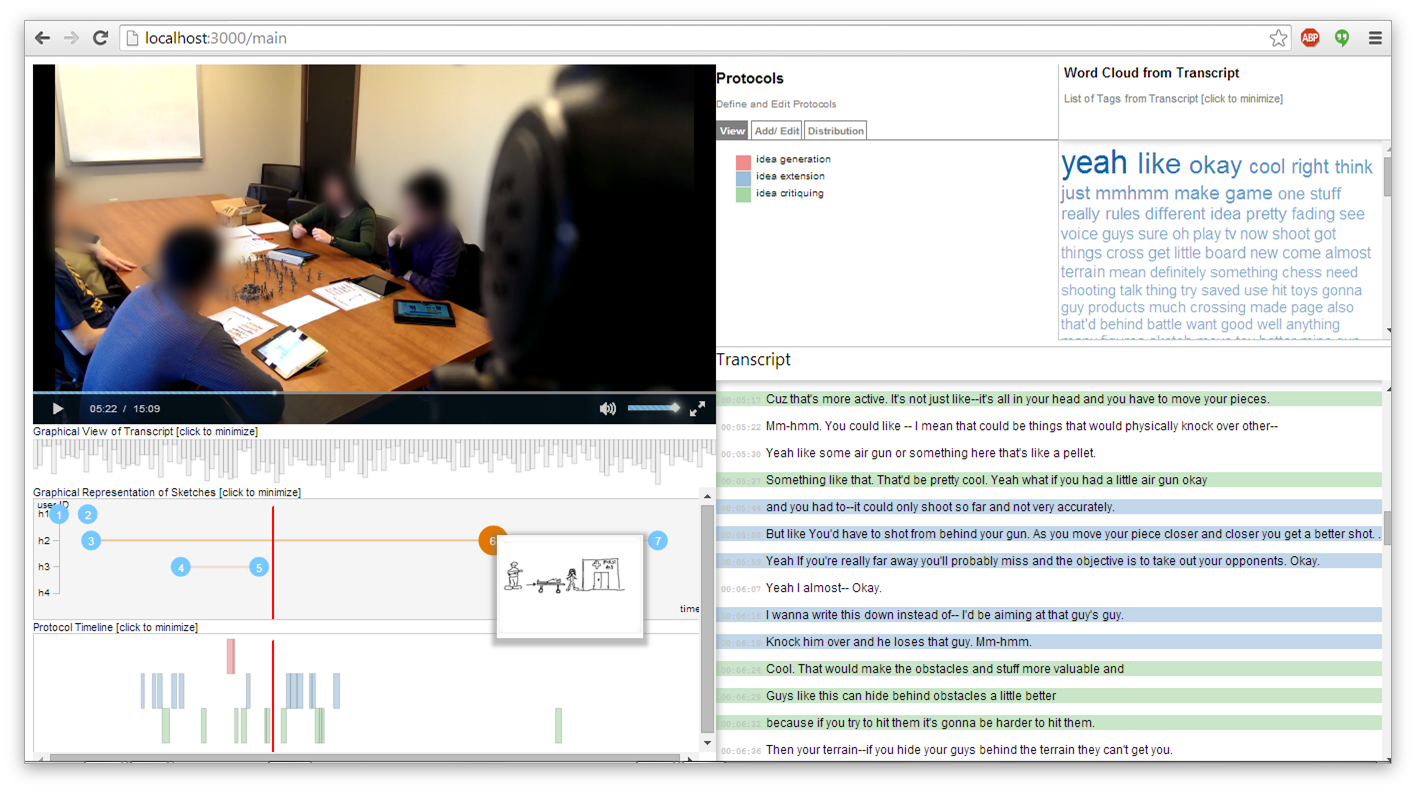
The second iteration added more timeline visualizations,
and reorganized them to entirely occupy the left half of the
frame under the video scrubber.
A visual indicator of video position is added over all
timeline views, and a “preview” option shows the
sketch represented by a marker in the sketch activity
timeline.
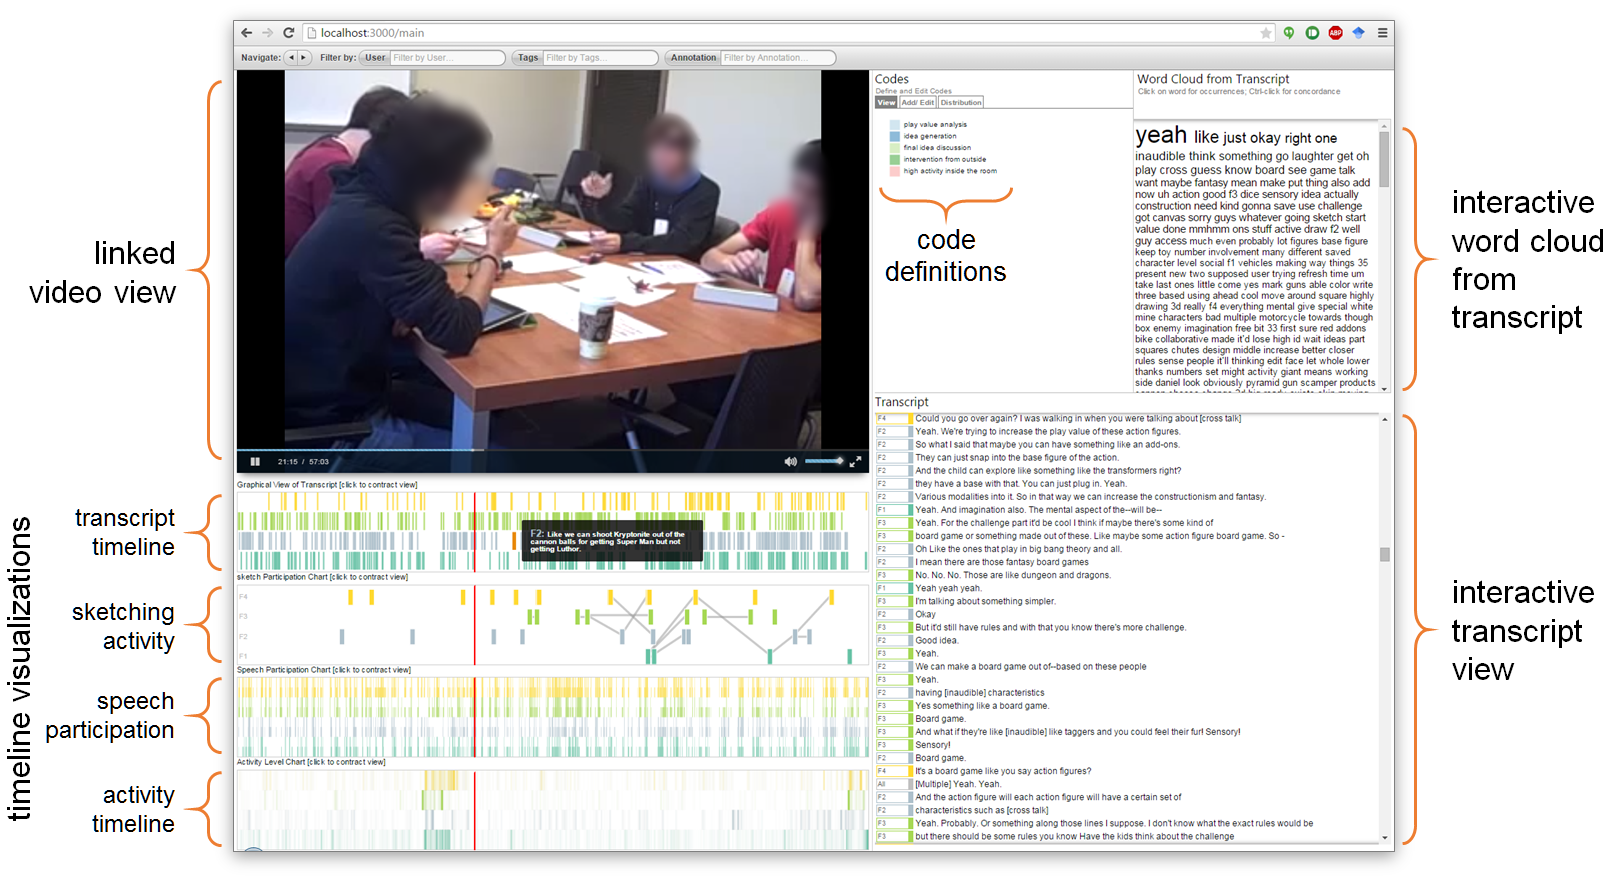
The final version of the design, shown earlier on this page, further separated the timeline visualizations by speaker, and color-coded the data to identify speakers across speech and activity timelines. The image below shows a detail of the timeline view.
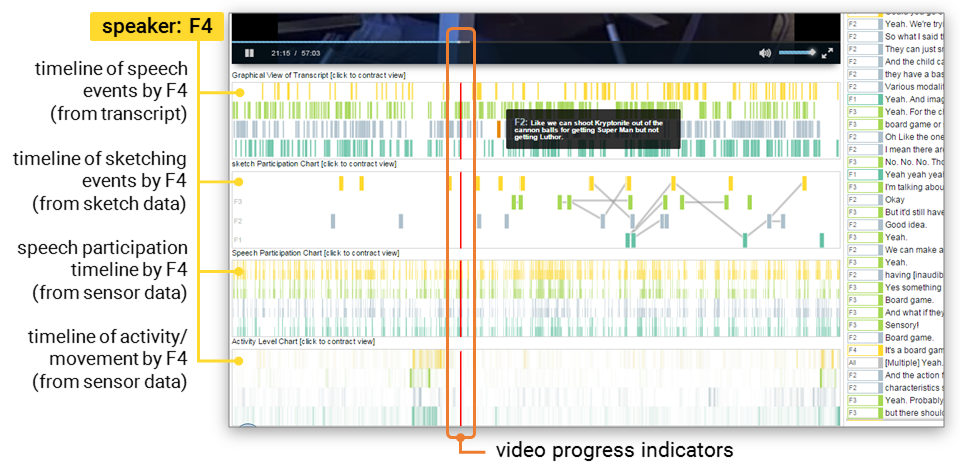
A detail of the timeline portion in the final interface
shows the use of color to identify speakers; this maintains
consistency across timeline views.
The views are interactive: clicking on a timeline element
skips the video to that timestamp, to provide context.
The video below demonstrates interactions in VizScribe, and how it is used to analyze a design sesssion:
RELEVANT PUBLICATION
VizScribe: A visual Analytics approach to understand designer behavior
International Journal of Human-Computer Studies, 100,
pp.66–80, 2017.
PDF |
VIDEO |
GITHUB |
WIKI